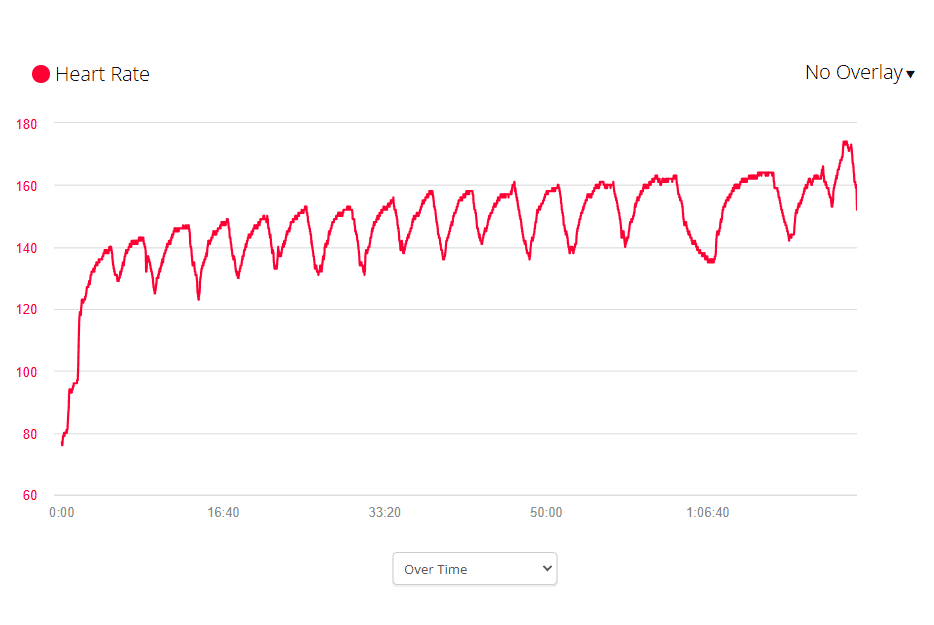
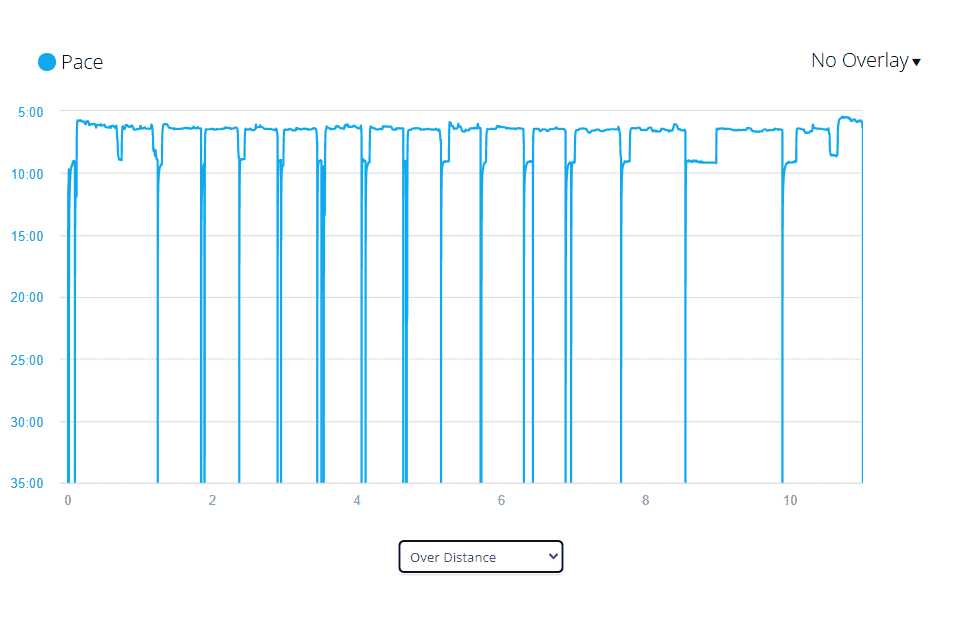
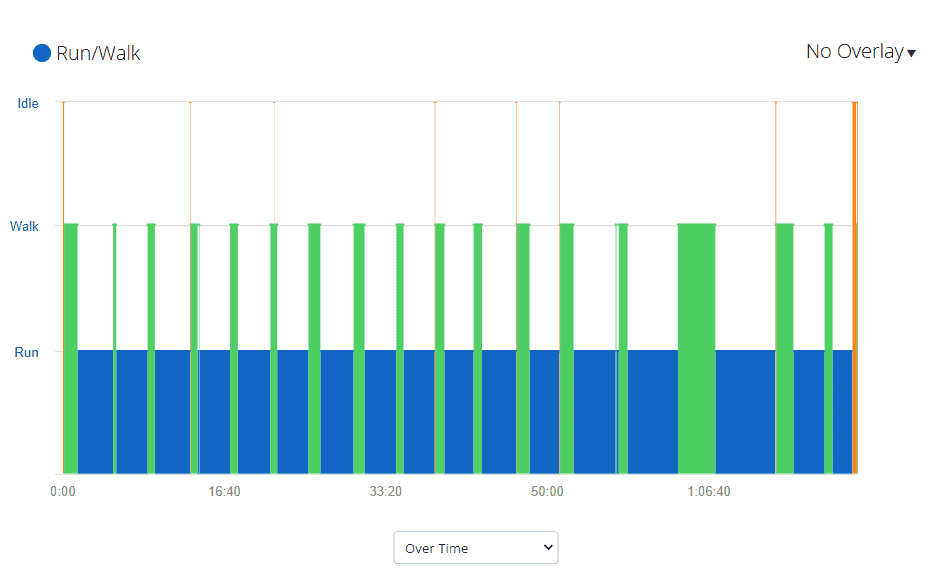
https://connect.garmin.com/modern/activity/20169350924 25 aug 2025 – treadmill run – i ran in monday morning time 11am-1pm approx. my legs definitely tired after my 16km run on saturday, so started quite slow. around 2km distance only i felt that i cud run at all, till then i was not in rythm. as always, the 3-5 km is where i am most productive, after 60 minutes i take a big walk break. since i wanted to do 10km under 80, i ran at 10kmph when i reached 9.7 km, hence u can see the higher heart rate towards end. burnt 950 calories thru this activity, lost 1.4 litre water ( hence 1.4kg lighter, momentarily). bmp avg 147, max to 170. ran for 60 min, walk for 20 min, so 3:1 ratio. pace is 7.27 min/km, which is cool. avg speed is 8kmph, max speed reached is 11kmph. 90 cm is my stride length
Discover more from saro22.com
Subscribe now to keep reading and get access to the full archive.